


Project Overview
This project aims to provide comprehensive insights into the store's 2019 sales performance, uncovering key trends, patterns, and metrics. Additionally, it will address specific questions concerning profitability, monthly performance, and optimal marketing focus.
Key Questions:
Profitability: Is the claim of losses in April, May, June, and July accurate?
Monthly Performance: What is the overall monthly sales trend throughout 2019? Are there any notable peaks or dips?
Marketing Optimization: Does data support the Assistant Manager's suggestion to prioritize marketing efforts in Los Angeles, New York, Atlanta, San Francisco, and Seattle? Should this strategy be pursued?
Data Sources
I got a zip file with everything I needed for this challenge. Inside the zip file, there were a few things:
A bak file
The problem statement in a PowerPoint file
The data dictionary in another PowerPoint file
I uploaded all these files to my GitHub.
I had never seen a bak file before, so I had to look it up. Turns out, bak is just a short way of saying backup (I thought it would be fancier). The bak file is basically a copy of another file, just in case something bad happens to the original one.
The organizers of the challenge told us to use Microsoft SQL Server (MSSQL) or any RDBMS to restore the bak file. I found this video on YouTube that showed me how to do it with MSSQL.
And guess what? It actually worked! I ended up with this database called Sale_2019. And it had different tables for each month of the year 2019.
Data Cleaning and Transformation
The first thing I did was to go view the contents of all tables with to familiarize myself with the structure. All 12 tables had the same columns:
Order_IdProductQuantity_OrderedPrice_EachOrder_DatePurchase_Address
I quickly looked at all 12 tables, and the February table seemed weird. Instead of having integers like the other tables, the data under its Order_Id column had dates. Just to be sure, I used the code below to check the types of data in each table's columns.
SELECT TABLE_NAME, COLUMN_NAME, DATA_TYPE
FROM INFORMATION_SCHEMA.COLUMNS
WHERE TABLE_NAME = 'Table_Name';
To make sure the Order_IDs for February are all good, I looked at the January table. Turns out, the order ids in January go in order, like one after the other. The last order id in January was 150501, so the next one for February should be 150502.
The first date in February's Order_ID is 2002-05-15. To get the right order id, I concatenated the day, month, and the last two digits of the year using the DATEPART function. I had to change the dateparts into strings first because you can only concatenate strings . Then I changed the result into an integer so it matches the order ids in the other tables.
--Format Order_ID for February table appropriately
UPDATE Sales_February_2019
SET Order_ID = RIGHT('0' + CAST(DATEPART(DAY, Order_ID) AS VARCHAR(2)), 2) +
                RIGHT('0' + CAST(DATEPART(MONTH, Order_ID) AS VARCHAR(2)), 2) +
                RIGHT(CAST(YEAR(Order_ID) AS VARCHAR(4)), 2);

--Change Order_ID in February from varchar to int
ALTER TABLE Sales_February_2019
ALTER COLUMN Order_ID int;
Now that I have all my data in order, I created a new table, overall_sales , which will hold all the data from the 12 tables. I joined the 12 tables with UNION ALL and inserted the result into overall_sales .
After making sure all my data are organized, I created a new table called overall_sales. It will hold all the data from the 12 other tables. To make it happen, I joined those 12 tables using something called UNION ALL. And then, I just put the result into overall_sales.
--Create an overall_sales table that will hold data from the other tables
CREATE TABLE overall_sales(
order_id int,
product varchar(50),
quantity_ordered tinyint,
price_each float,
order_date datetime2,
purchase_address varchar(50)
);

--Concatenate data from other tables into overall_sales
INSERT INTO overall_sales
SELECT * FROM Sales_January_2019
UNION ALL
SELECT * FROM Sales_February_2019
UNION ALL
SELECT * FROM Sales_March_2019
UNION ALL
SELECT * FROM Sales_April_2019
UNION ALL
SELECT * FROM Sales_May_2019
UNION ALL
SELECT * FROM Sales_June_2019
UNION ALL
SELECT * FROM Sales_July_2019
UNION ALL
SELECT * FROM Sales_August_2019
UNION ALL
SELECT * FROM Sales_September_2019
UNION ALL
SELECT * FROM Sales_October_2019
UNION ALL
SELECT * FROM Sales_November_2019
UNION ALL
SELECT * FROM Sales_December_2019;
I looked at all the columns in the overall_sales table to see if there were any missing values. Turns out, every column had some missing values, which are usually just ignored. But I decided to take a closer look to see if getting rid of them would mess up my data.
There were a bunch of missing values in the Order_ID column, especially in February. But those rows still had information in the other columns, so if I deleted them, I would lose important data.
Then, I checked the unique values in the Product column. I found some rows where the Product was listed as NULL, and others where it had Product as the product name, which is inappropriate. The rows with NULL for the Product also had missing values in the other columns, while the rows with Product as the product name had information in all the columns, but they were the column names of the respective columns. Since both cases were useless, I decided to delete that data.
--Check for unique products
SELECT DISTINCT product
FROM overall_sales
ORDER BY product;

--Delete data where product is null
DELETE FROM overall_sales
WHERE product IS NULL;

--Delete data where product is Product
DELETE FROM overall_sales
WHERE product = 'Product';
I created a new column called revenue and populated it with the answer I got by multiplying quantity_ordered by price_each. I made sure to round the answer to two decimal places so it's easier to read.
Then, I created another column called order_hour where I put the hour when each order was made. I extracted the hour from order_date with the DATEPART function.
Next, I created a column called city to show which city each order came from. The addresses in purchase_address all have a similar pattern, where the city name is between two commas. I used this pattern with the SUBSTRING and CHARINDEX functions to find the city name. I wrote the code I used below and added comments to explain it better.
--Add a revenue column
ALTER TABLE overall_sales
ADD revenue float;

--Update revenue as quantity_ordered * price_each
--Rounded to 2 decimal places for better readability
UPDATE overall_sales
SET revenue = ROUND(quantity_ordered * price_each, 2);

--Add an order_hour column
ALTER TABLE overall_sales
ADD order_hour int;

--Update the order_hour as the hour part of order_date
UPDATE overall_sales
SET order_hour = DATEPART(HOUR, order_date);

--Create new column for city
ALTER TABLE overall_sales
ADD city VARCHAR(50);

--Update city as city name extracted from purchase_address
UPDATE overall_sales
SET city = SUBSTRING(
                purchase_address,
                CHARINDEX(', ', purchase_address) + 2,                                --Index of comma and space
                (CHARINDEX(',', purchase_address, CHARINDEX(', ', purchase_address) + 2) - --To get length of substring,
                (CHARINDEX(', ', purchase_address) + 2))    --Subtract index of first comma from index of the second
                );
According to the problem statement of this project, all the information was from the year 2019. But then I saw some dates as far ahead as 2030 in order_date. It was really strange! What was even more interesting was that all the days were 19. That's when I realized I needed to switch the days with the year.
To fix this, the first thing I did was change order_date from datetime to date data type. This way, I could get rid of the time part since I didn't need it (I had already extracted the hour earlier). Then, I used SQL's string formatting for dates to reformat it like this:
I added 20 to the days to make it 2019.
I left the month as it was.
And finally, I made the year be in a 2-digit format, which became the new day.
Below, you can see the code I used to make these changes.
--Convert order_date from datetime2 to date
ALTER TABLE overall_sales
ALTER COLUMN order_date date;

--Format order_date properly
UPDATE overall_sales
SET order_date = FORMAT(order_date, '20dd-MM-yy');
You can check out the full sql script for the whole cleaning process in my github.
Now that my data is clean, I connected to my database via Power BI and imported the data for visualization. But first, I added some necessary calculated measures and columns to my data using DAX. You can find them in the code block below.
No. of orders = COUNTROWS(overall_sales)

total_revenue = SUM(overall_sales[revenue])

aov = DIVIDE(SUM(overall_sales[revenue]), [No. of orders]) --Average Order Value

No. of unique products = DISTINCTCOUNT(overall_sales[product])

month_name = FORMAT(overall_sales[order_date], "MMM") --Short format of month name

day_name = FORMAT(WEEKDAY(overall_sales[order_date]), "ddd") --Short format of day name
Exploratory Data Analysis and Findings
Using DAX, I generated the following sale metrics:
The total number of orders made in 2019 is approximately 186K.
The total revenue was $34.5M.
The overall average order value is $185.5
The store sold 19 different products in 2019.
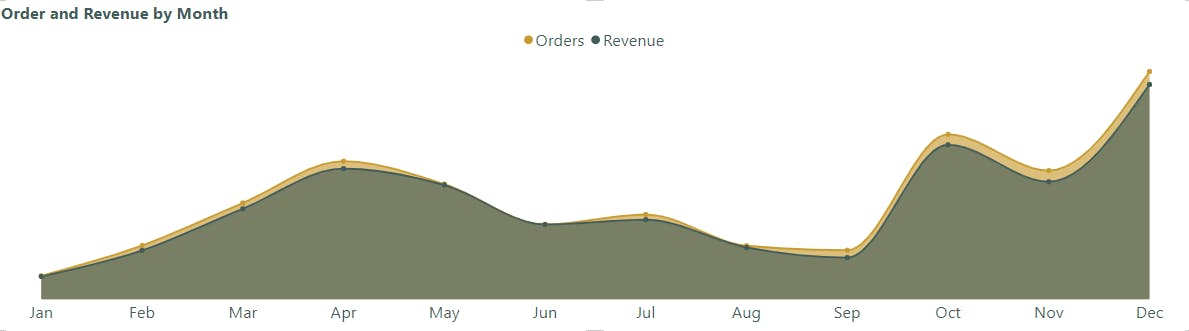
The Accountant reported that the store made loss in the month of April, May, June and July as compared to other months. While there wasn't sufficient data to determine profit or loss, revenue generated dipped in the aforementioned months (except In April).
Revenue rose from the beginning of the year, peaking in April. From there, it was a gradual decline till September. Interestingly, volume of orders placed also followed this trend.
I went deeper to see the weekly and daily trend of order volume.
Throughout the week, order volume follows a distinctive pattern. Tuesdays see a surge, making them the busiest day, while Fridays experience a notable dip, becoming the quietest. The remaining days hover around a consistent average.

However, in a typical day, order volume peak around lunchtime (11am-1pm) and again in the evening (6pm-8pm). They steadily rise from dawn (3am) to morning (10am) and wind down from evening (8pm) to midnight.

The Assistant manager suggested that the store should place more marketing attention on the following cities - Los Angeles, New York, Atlanta, San Francisco and Seattle as they seem to generate more revenue. I looked at how much revenue and order each city contributed to the total.
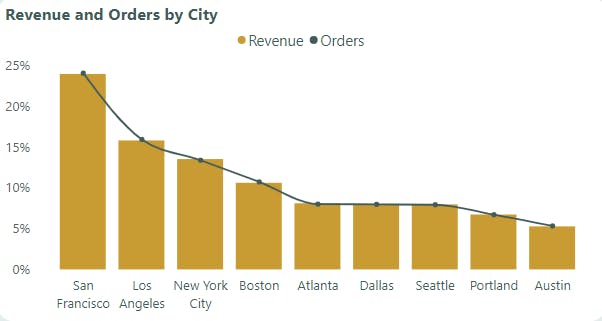
Four major cities – San Francisco, Los Angeles, New York City, and Boston – surpassed the 10% mark in both order volume and revenue. San Francisco dominated, contributing over 20% to the total.
The Assistant manager wasn't right about Seattle.
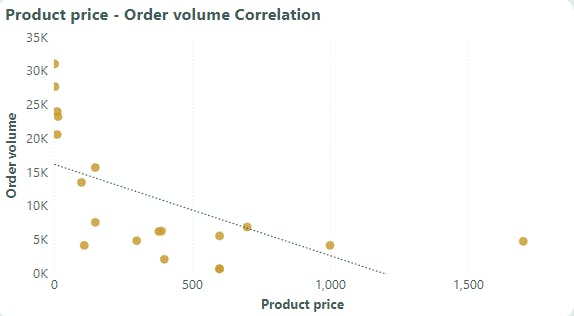
I further explored to see if there's a relation between the price of products and the amount of times they're ordered.
The cheaper products, which are everyday essentials like charging cables and headphones, were ordered more. The more expensive products, which are major appliances like washing machines, monitors and laptops, weren't ordered as much.
Recommendations
Seasonal Promotions: Boost sales during the slower months, like January and June to September, by offering targeted campaigns or discounts. This way, you can attract more customers and make more money!
Targeted Promotions: Take advantage of the weekly order trend by offering flash sales or special deals on Tuesdays. Since more people place orders on this day, you can make even more sales. You can also think about offering discounts on Mondays when fewer people order.
Time-based Promotions: Make the most of the busiest times of the day, like lunchtime and evenings, by offering limited-time deals. This way, customers will feel a sense of urgency to buy your products before the offer ends.
Location-based Marketing: Focus your marketing efforts on major cities like San Francisco, Los Angeles, New York, and Boston. These cities bring in a lot of money and orders. You can even consider running special campaigns or partnering with local businesses in these areas.
Bundling and Discounts: Encourage customers to buy more by offering bundles and discounts. For example, you can combine expensive items like laptops and phones with popular lower-priced products like charging cables and headphones. This way, people will be more tempted to buy the more expensive items.
So, by using these different strategies, you can attract more customers, make more sales, and grow your business!